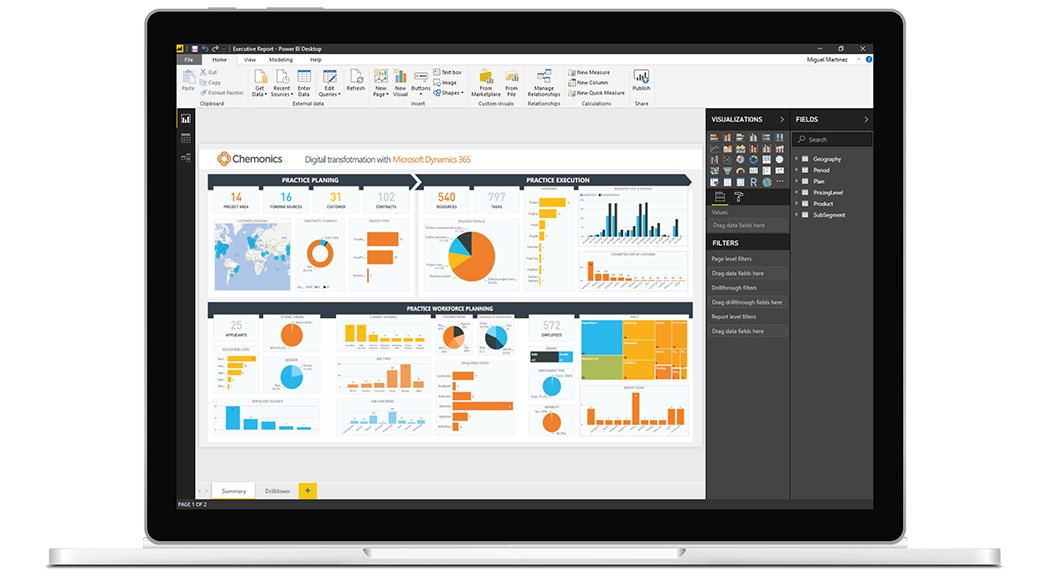
Transform your daily, weekly and monthly data into visual dashboards! This session will provide an introduction to the Basics of Microsoft Power BI so that you can take data from your spreadsheets, and/or monthly reports and turn them into visual representations of your data. Your team will have easy access to the information they need to help them make business decisions. We will cover the following and more:
- How to connect your existing excel spreadsheet data with Power BI
- Share the dashboard with appropriate team members
- Include Power BI into your Leadership / Department “Teams” meetings
Join us to start your journey of Visualizing your Metrics & Key Performance Indicators!

